
Automation
Dashboards & Reporting
One live view of leads, sales and delivery, pulled from the tools you already use.
Interactive demo · illustrative data
See it working.
Click through it yourself. Nothing here is connected to a real account.
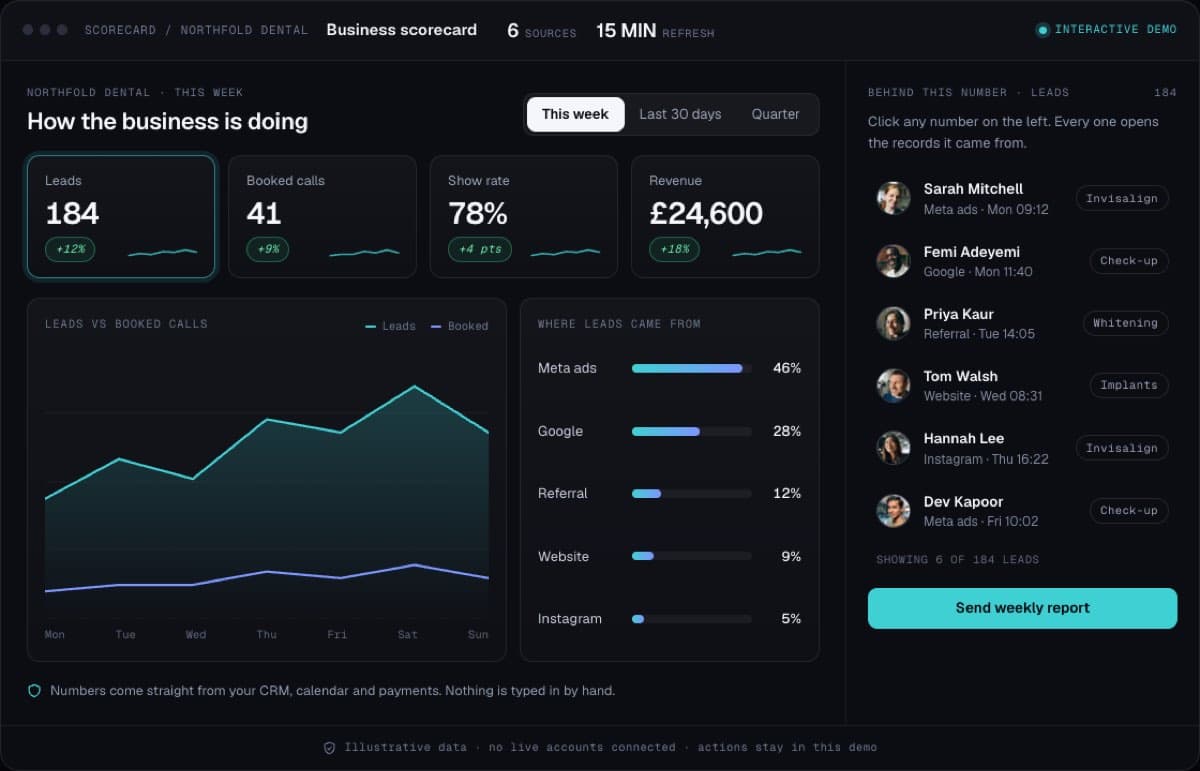
What you’ll do · about 30 seconds
- Pick a date range.
- Click any number to see who is behind it.
- Send the weekly report.
What this could be worth · example maths
6 hours a week of a manager pulling numbers, at £50 an hour, plus a drop in bookings spotted the same week: ≈ £15,600 a year saved
The problem
Why businesses come to us.
When numbers live in five tools, reporting becomes a weekly copy-and-paste job and decisions wait on spreadsheets that are already out of date.
What’s included
- Dashboards for leadership, sales and delivery
- Data pulled from CRM, ads, payments and project tools
- Clear definitions for every metric
- Scheduled reports for your team or clients
- Drill-down to the records behind each number
What changes
What it means for your team.
01
No more manual weekly reporting
02
Everyone works from the same numbers
03
Problems show up while there is still time to act
Works well with
Connect it to the rest of the system.
Before we start
Who this is for.
We would rather tell you now than halfway through a build.
A good fit
- Owners who wait on someone to pull the numbers every week
- Businesses with data in several tools that never line up
Not the right fit
- Businesses with no tracked data at all yet
- Anyone after a vanity dashboard nobody acts on
Questions
What businesses ask us about dashboards & reporting.
Not covered here? Book a call and ask us.
Can one dashboard pull data from all our tools?
Yes. We pull from your CRM, ad accounts, payment provider and project tools into one live view, so nobody has to copy numbers into a spreadsheet each week.
How do you make sure the numbers are right?
Every metric gets a written definition agreed with your team before it is built, and each number can be opened to show the records behind it. If two tools disagree, the definition says which one is the source.
Do we need a data warehouse first?
Not always. Many businesses can report straight from the tools they already use. We only add a separate data store when the volume or the number of sources needs it, and that is decided in the scope.
How much does a custom dashboard cost?
Every build is priced from a written scope. Most scoped builds sit between £5,000 and £20,000 ($10,000 to $30,000 in the US). It starts with a free 30-minute call, and then we come back and show you a working demo of what we would build for your business before you decide anything.
Guides
Before you build dashboards & reporting.
The 9 numbers every service business dashboard needs
From enquiries to cash collected, with where each number comes from.
Read the guideGUIDEThe real cost of disconnected tools
A worked example of the hidden time, errors and missed enquiries.
Read the guideGUIDE5 spreadsheets that should be software
And five that are fine as they are, with the warning signs that tell them apart.
Read the guidePRICINGWhat does custom software cost in the UK?
What moves a build up or down the range, with a worked example.
Read the guideCOMPARISONGoHighLevel alternative: a system you own
When to stay, when to move, and how to move off safely.
Read the guidePRICINGWhat does a custom business dashboard cost?
Data sources, definitions and views: what moves the price.
Read the guideGUIDEA custom reporting dashboard for business owners
One live view of your numbers, and when a spreadsheet is enough.
Read the guideINDUSTRY GUIDEClient portal and reporting software for marketing agencies
Onboarding, approvals and client reports that build themselves.
Read the guideReady to talk about dashboards & reporting?
Book a free call. Tell us where you are and what is getting in the way, and we will scope it before anything is built.